class: center, middle, inverse, title-slide # R 활용 맞춤형 통계지원 소개 ## CRScube 세미나 ### 김진섭 ### 차라투(주) --- layout: true <div class="my-footer"><span><a href="https://www.zarathu.com">Zarathu Co.,Ltd</a>                             <a href="https://github.com/jinseob2kim">김진섭</a></span></div> --- # Executive Summary .large[ * [R](https://www.r-project.org/)로 통계분석 뿐 아니라 [논문](https://github.com/rstudio/rticles), [발표 슬라이드](https://github.com/yihui/xaringan), [홈페이지](https://github.com/rstudio/blogdown), [블로그](https://rstudio.github.io/distill/), [웹 어플리케이션](https://shiny.rstudio.com/)을 만들 수 있다. ] -- .large[ * 의학연구자들에게 [맞춤형 통계 웹](http://app.zarathu.com)을 제공하는 것을 업으로 삼고 있다. * 범용으로 쓰일만한 것들을 [웹](http://app.zarathu.com)과 [R 패키지](https://github.com/jinseob2kim/jsmodule)로 배포한다. ] -- .large[ * [심혈관중재학회](http://www.kscvi.org/new_ksic2015/community/main/kbc)와 계약, 1년간 [레지스트리](https://clinicaltrials.gov/ct2/show/NCT03068494) 연구에 대한 통계지원을 맡고 있다. * [심평원](https://opendata.hira.or.kr/)/[보험공단](https://nhiss.nhis.or.kr/) 빅데이터 연구도 개별적으로 지원중. ] --- class: center, middle # [R](https://www.r-project.org/)의 확장 --- # [R](https://www.r-project.org/)의 확장 [R](https://www.r-project.org/)은 이제 단순한 통계프로그램이 아님. * [R Markdown](https://rmarkdown.rstudio.com/): 논문과 발표자료를 [R](https://www.r-project.org/) 에서 직접 만듦. [과거 정리 내용](https://blog.zarathu.com/posts/2019-01-03-rmarkdown/) -- * [blogdown](https://github.com/rstudio/blogdown): 홈페이지도 만들 수 있음. 당사 홈페이지도 이것과 [distill](https://rstudio.github.io/distill/) 로 제작. -- * [Shiny](https://shiny.rstudio.com/), [Shiny Server](https://www.rstudio.com/products/shiny/shiny-server/): 서버 구축하고 웹기반 앱을 만들 수 있음. -- 법인 설립 후 모든 작업에 [R](https://www.r-project.org/)을 이용함. --- # 논문 [R](https://www.r-project.org/)에서 글, 그림, 테이블, 참고문헌까지 직접 작성. * [rticles](https://github.com/rstudio/rticles): 대부분 학술지의 템플릿을 포함. <img src="https://bookdown.org/yihui/rmarkdown/images/rticles-templates.png" width="50%" style="display: block; margin: auto;" /> [준비하던 박사논문](https://blog.zarathu.com/posts/2018-11-08-mdlm/) --- # 발표 슬라이드 논문쓸 때 이용했던 R 코드 활용, 빠르게 발표 슬라이드 제작 가능. * [기본 템플릿](https://rmarkdown.rstudio.com/lesson-11.html), [xaringan](https://github.com/yihui/xaringan) 패키지: 이 슬라이드도 [xaringan](https://github.com/yihui/xaringan)으로 제작. <img src="https://user-images.githubusercontent.com/163582/53144527-35f7a500-3562-11e9-862e-892d3fd7036d.gif" width="80%" style="display: block; margin: auto;" /> --- # 홈페이지 [blogdown](https://github.com/rstudio/blogdown), [distill](https://rstudio.github.io/distill/): [깃허브](https://pages.github.com/) 통해 무료 웹호스팅 가능. <img src="https://www.storybench.org/wp-content/uploads/2019/05/blogdown-new-site-e1557149319624-730x457.png" width="80%" style="display: block; margin: auto;" /> [홈페이지](https://github.com/zarathucorp/zarathu), [블로그](https://github.com/zarathucorp/blog) --- # 웹 앱 [Shiny](https://shiny.rstudio.com/): [R](https://www.r-project.org/) 코드만으로 웹앱 제작 <img src="https://shiny.rstudio.com/images/debugging/kmeans-showcase.gif" style="display: block; margin: auto;" /> --- # 웹 서버 [Shiny Server](https://www.rstudio.com/products/shiny/shiny-server/): [Shiny](https://shiny.rstudio.com/)를 서버에서 구동. <img src="https://shiny.rstudio.com/images/shiny-server-pro.png" style="display: block; margin: auto;" /> [Zarathu app](http://app.zarathu.com) --- class: center, middle # 맞춤형 서비스 --- # 맞춤형 웹 * 안과 + 시야 데이터 분석 + 국민건강영양조사 백내장/안검하수 연구 * 내과 + 심혈관질환 위험 요인 생존분석 + 심혈관 생리학 지표 계산 + 대장암 위험 요인 생존분석 + 타 연구결과 정리 * 정신건강의학과 + 외상후 스트레스 장애 네트워크 분석 --- # 시야데이터: 일반적인 통계 기술통계, 회귀/생존분석, 간단한 그림 [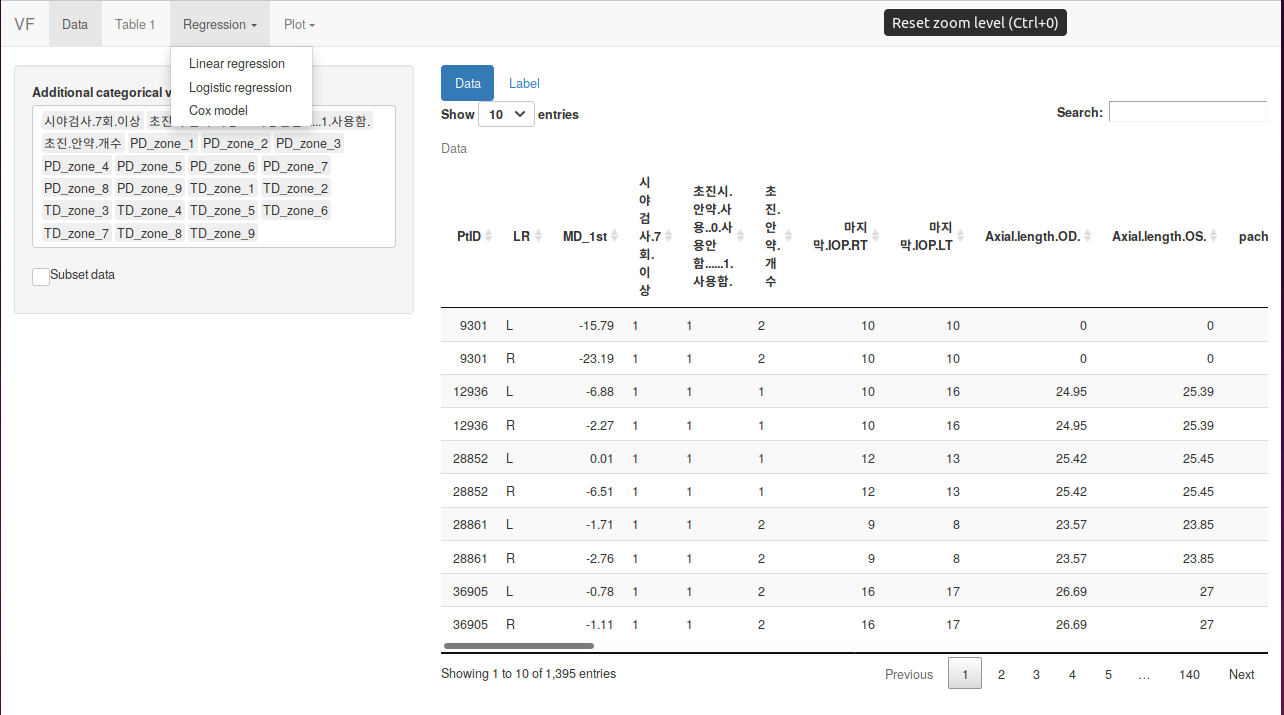](http://app.zarathu.com) --- # 국민건강영양조사 표본조사데이터: [survey](http://r-survey.r-forge.r-project.org/survey/) 패키지 적용, 표본가중치 고려한 통계 [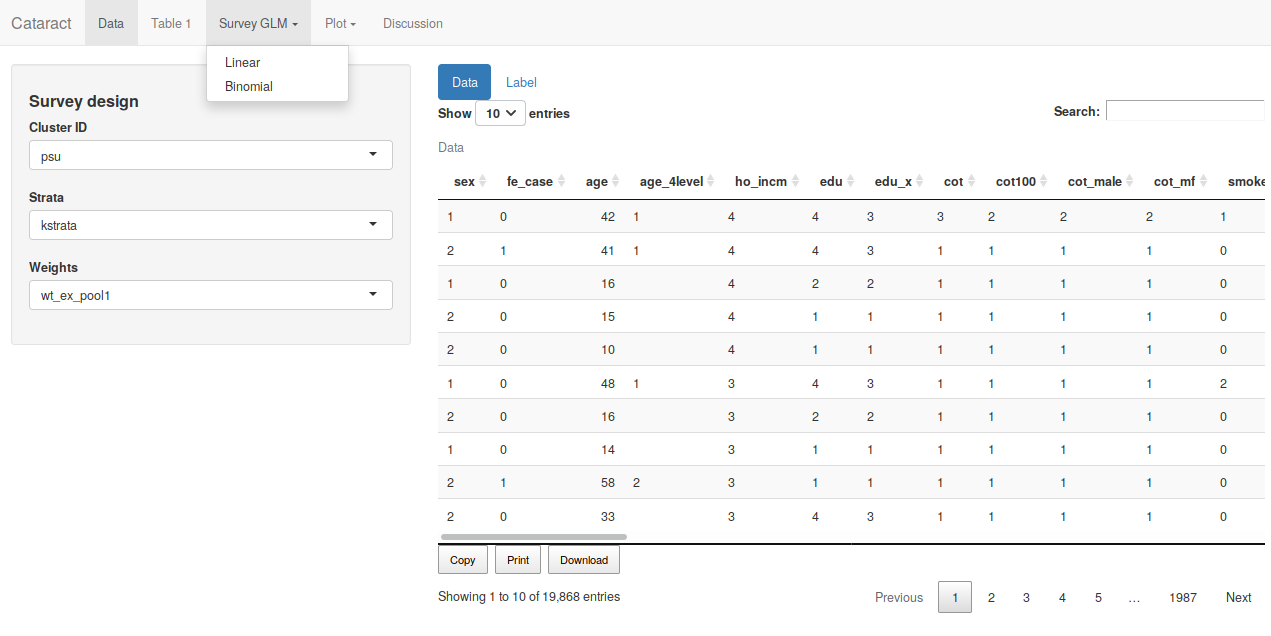](http://app.zarathu.com) --- # 심혈관질환 위험요인 반복측정: [geepack](https://cran.r-project.org/web/packages/geepack/index.html) 패키지 적용, 한 사람이 2개 이상의 심혈관 시술 받음. [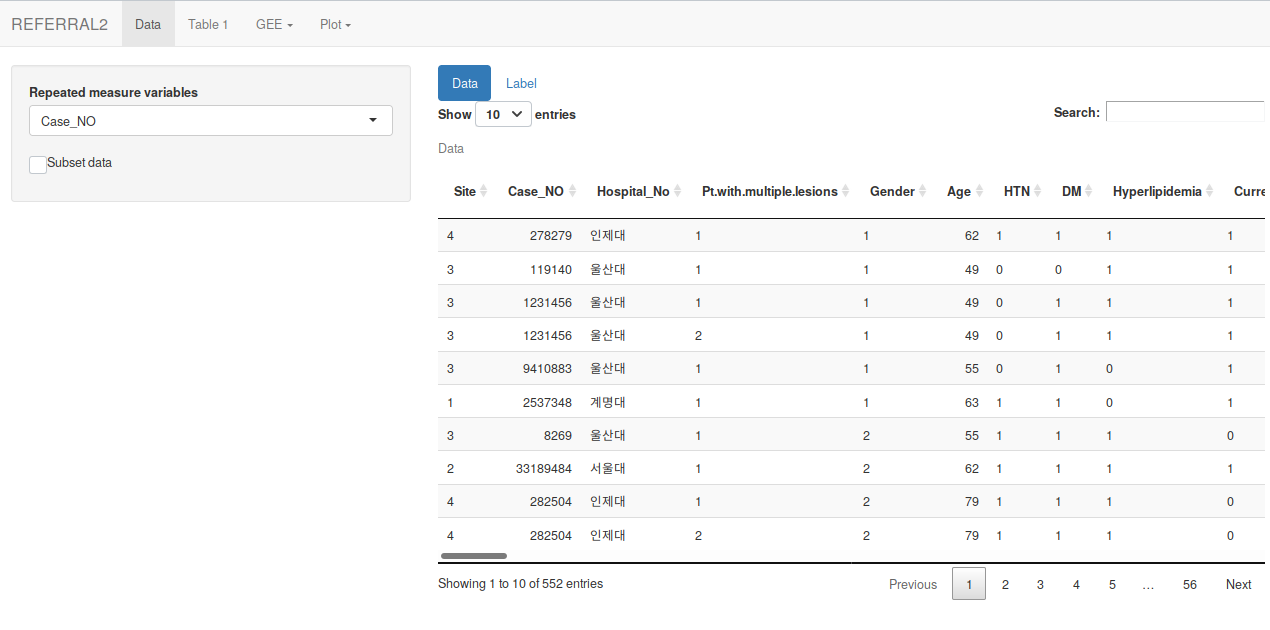](http://app.zarathu.com) --- # 맞춤형 그림 논문 맞춤형 [그림](https://ildiczeller.com/2018/02/11/downloadable-ggplots-in-shiny/)과 [테이블](https://rstudio.github.io/DT/extensions.html)을 다운로드 .pull-left[ [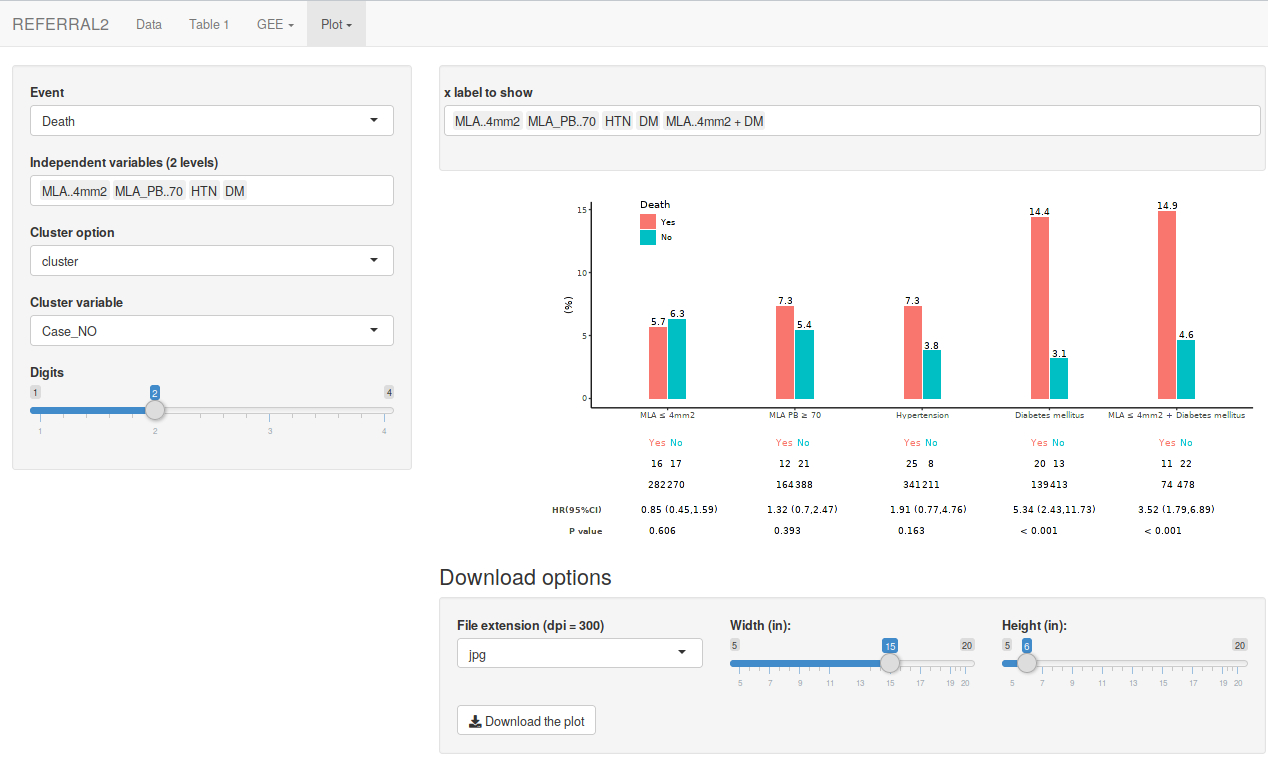](http://app.zarathu.com) ] .pull-right[ [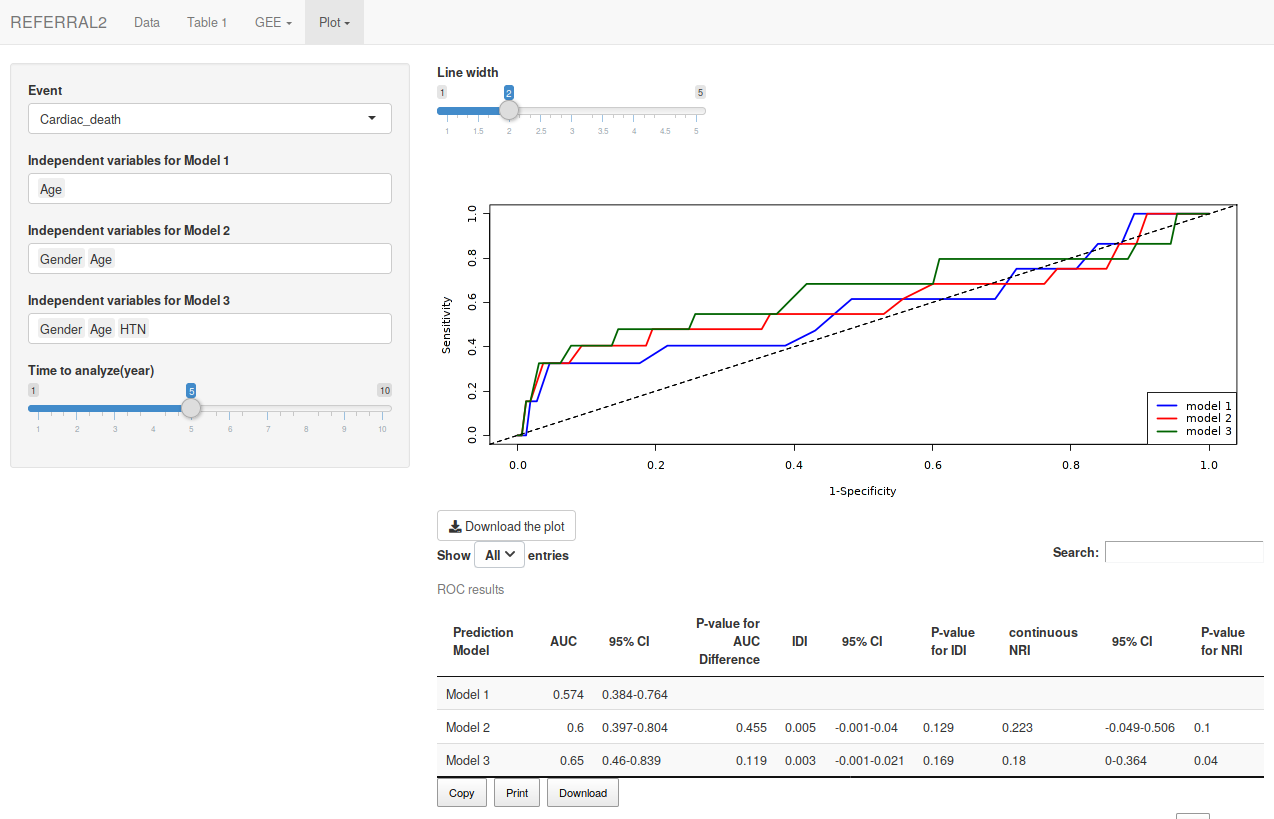](http://app.zarathu.com) ] --- # PPT에서 편집: `emf` 확장자 **PPT** 정확한 그림인식 위해 **emfPlus = F** 옵션 필수! ```r library(devEMF) emf("plot.emf", width = 7, height = 7, emfPlus = F) ggplot(mtcars, aes(mpg, cyl)) + geom_point() dev.off() ``` <img src="zzz.png" width="70%" style="display: block; margin: auto;" /> --- # 테이블 다운로드 예 [DT](https://rstudio.github.io/DT) 패키지의 `datatable` 함수 ```r datatable( * iris, extensions = 'Buttons', options = list( * dom = 'Bfrtip', # Button, filter, processing, table, information, pagination * buttons = c('copy', 'csv', 'excel', 'pdf', 'print'), scrollX = T # Scrolling X axis ) ) ``` 세부 `dom` 설정은 [여기](https://datatables.net/reference/option/dom) --- <div id="htmlwidget-fb28c22512f11a65c74e" style="width:100%;height:auto;" class="datatables html-widget"></div> <script type="application/json" data-for="htmlwidget-fb28c22512f11a65c74e">{"x":{"filter":"none","extensions":["Buttons"],"data":[["1","2","3","4","5","6","7","8","9","10","11","12","13","14","15","16","17","18","19","20","21","22","23","24","25","26","27","28","29","30","31","32","33","34","35","36","37","38","39","40","41","42","43","44","45","46","47","48","49","50","51","52","53","54","55","56","57","58","59","60","61","62","63","64","65","66","67","68","69","70","71","72","73","74","75","76","77","78","79","80","81","82","83","84","85","86","87","88","89","90","91","92","93","94","95","96","97","98","99","100","101","102","103","104","105","106","107","108","109","110","111","112","113","114","115","116","117","118","119","120","121","122","123","124","125","126","127","128","129","130","131","132","133","134","135","136","137","138","139","140","141","142","143","144","145","146","147","148","149","150"],[5.1,4.9,4.7,4.6,5,5.4,4.6,5,4.4,4.9,5.4,4.8,4.8,4.3,5.8,5.7,5.4,5.1,5.7,5.1,5.4,5.1,4.6,5.1,4.8,5,5,5.2,5.2,4.7,4.8,5.4,5.2,5.5,4.9,5,5.5,4.9,4.4,5.1,5,4.5,4.4,5,5.1,4.8,5.1,4.6,5.3,5,7,6.4,6.9,5.5,6.5,5.7,6.3,4.9,6.6,5.2,5,5.9,6,6.1,5.6,6.7,5.6,5.8,6.2,5.6,5.9,6.1,6.3,6.1,6.4,6.6,6.8,6.7,6,5.7,5.5,5.5,5.8,6,5.4,6,6.7,6.3,5.6,5.5,5.5,6.1,5.8,5,5.6,5.7,5.7,6.2,5.1,5.7,6.3,5.8,7.1,6.3,6.5,7.6,4.9,7.3,6.7,7.2,6.5,6.4,6.8,5.7,5.8,6.4,6.5,7.7,7.7,6,6.9,5.6,7.7,6.3,6.7,7.2,6.2,6.1,6.4,7.2,7.4,7.9,6.4,6.3,6.1,7.7,6.3,6.4,6,6.9,6.7,6.9,5.8,6.8,6.7,6.7,6.3,6.5,6.2,5.9],[3.5,3,3.2,3.1,3.6,3.9,3.4,3.4,2.9,3.1,3.7,3.4,3,3,4,4.4,3.9,3.5,3.8,3.8,3.4,3.7,3.6,3.3,3.4,3,3.4,3.5,3.4,3.2,3.1,3.4,4.1,4.2,3.1,3.2,3.5,3.6,3,3.4,3.5,2.3,3.2,3.5,3.8,3,3.8,3.2,3.7,3.3,3.2,3.2,3.1,2.3,2.8,2.8,3.3,2.4,2.9,2.7,2,3,2.2,2.9,2.9,3.1,3,2.7,2.2,2.5,3.2,2.8,2.5,2.8,2.9,3,2.8,3,2.9,2.6,2.4,2.4,2.7,2.7,3,3.4,3.1,2.3,3,2.5,2.6,3,2.6,2.3,2.7,3,2.9,2.9,2.5,2.8,3.3,2.7,3,2.9,3,3,2.5,2.9,2.5,3.6,3.2,2.7,3,2.5,2.8,3.2,3,3.8,2.6,2.2,3.2,2.8,2.8,2.7,3.3,3.2,2.8,3,2.8,3,2.8,3.8,2.8,2.8,2.6,3,3.4,3.1,3,3.1,3.1,3.1,2.7,3.2,3.3,3,2.5,3,3.4,3],[1.4,1.4,1.3,1.5,1.4,1.7,1.4,1.5,1.4,1.5,1.5,1.6,1.4,1.1,1.2,1.5,1.3,1.4,1.7,1.5,1.7,1.5,1,1.7,1.9,1.6,1.6,1.5,1.4,1.6,1.6,1.5,1.5,1.4,1.5,1.2,1.3,1.4,1.3,1.5,1.3,1.3,1.3,1.6,1.9,1.4,1.6,1.4,1.5,1.4,4.7,4.5,4.9,4,4.6,4.5,4.7,3.3,4.6,3.9,3.5,4.2,4,4.7,3.6,4.4,4.5,4.1,4.5,3.9,4.8,4,4.9,4.7,4.3,4.4,4.8,5,4.5,3.5,3.8,3.7,3.9,5.1,4.5,4.5,4.7,4.4,4.1,4,4.4,4.6,4,3.3,4.2,4.2,4.2,4.3,3,4.1,6,5.1,5.9,5.6,5.8,6.6,4.5,6.3,5.8,6.1,5.1,5.3,5.5,5,5.1,5.3,5.5,6.7,6.9,5,5.7,4.9,6.7,4.9,5.7,6,4.8,4.9,5.6,5.8,6.1,6.4,5.6,5.1,5.6,6.1,5.6,5.5,4.8,5.4,5.6,5.1,5.1,5.9,5.7,5.2,5,5.2,5.4,5.1],[0.2,0.2,0.2,0.2,0.2,0.4,0.3,0.2,0.2,0.1,0.2,0.2,0.1,0.1,0.2,0.4,0.4,0.3,0.3,0.3,0.2,0.4,0.2,0.5,0.2,0.2,0.4,0.2,0.2,0.2,0.2,0.4,0.1,0.2,0.2,0.2,0.2,0.1,0.2,0.2,0.3,0.3,0.2,0.6,0.4,0.3,0.2,0.2,0.2,0.2,1.4,1.5,1.5,1.3,1.5,1.3,1.6,1,1.3,1.4,1,1.5,1,1.4,1.3,1.4,1.5,1,1.5,1.1,1.8,1.3,1.5,1.2,1.3,1.4,1.4,1.7,1.5,1,1.1,1,1.2,1.6,1.5,1.6,1.5,1.3,1.3,1.3,1.2,1.4,1.2,1,1.3,1.2,1.3,1.3,1.1,1.3,2.5,1.9,2.1,1.8,2.2,2.1,1.7,1.8,1.8,2.5,2,1.9,2.1,2,2.4,2.3,1.8,2.2,2.3,1.5,2.3,2,2,1.8,2.1,1.8,1.8,1.8,2.1,1.6,1.9,2,2.2,1.5,1.4,2.3,2.4,1.8,1.8,2.1,2.4,2.3,1.9,2.3,2.5,2.3,1.9,2,2.3,1.8],["setosa","setosa","setosa","setosa","setosa","setosa","setosa","setosa","setosa","setosa","setosa","setosa","setosa","setosa","setosa","setosa","setosa","setosa","setosa","setosa","setosa","setosa","setosa","setosa","setosa","setosa","setosa","setosa","setosa","setosa","setosa","setosa","setosa","setosa","setosa","setosa","setosa","setosa","setosa","setosa","setosa","setosa","setosa","setosa","setosa","setosa","setosa","setosa","setosa","setosa","versicolor","versicolor","versicolor","versicolor","versicolor","versicolor","versicolor","versicolor","versicolor","versicolor","versicolor","versicolor","versicolor","versicolor","versicolor","versicolor","versicolor","versicolor","versicolor","versicolor","versicolor","versicolor","versicolor","versicolor","versicolor","versicolor","versicolor","versicolor","versicolor","versicolor","versicolor","versicolor","versicolor","versicolor","versicolor","versicolor","versicolor","versicolor","versicolor","versicolor","versicolor","versicolor","versicolor","versicolor","versicolor","versicolor","versicolor","versicolor","versicolor","versicolor","virginica","virginica","virginica","virginica","virginica","virginica","virginica","virginica","virginica","virginica","virginica","virginica","virginica","virginica","virginica","virginica","virginica","virginica","virginica","virginica","virginica","virginica","virginica","virginica","virginica","virginica","virginica","virginica","virginica","virginica","virginica","virginica","virginica","virginica","virginica","virginica","virginica","virginica","virginica","virginica","virginica","virginica","virginica","virginica","virginica","virginica","virginica","virginica","virginica","virginica"]],"container":"<table class=\"display\">\n <thead>\n <tr>\n <th> <\/th>\n <th>Sepal.Length<\/th>\n <th>Sepal.Width<\/th>\n <th>Petal.Length<\/th>\n <th>Petal.Width<\/th>\n <th>Species<\/th>\n <\/tr>\n <\/thead>\n<\/table>","options":{"dom":"Bfrtip","buttons":["copy","csv","excel","pdf","print"],"scrollX":true,"columnDefs":[{"className":"dt-right","targets":[1,2,3,4]},{"orderable":false,"targets":0}],"order":[],"autoWidth":false,"orderClasses":false}},"evals":[],"jsHooks":[]}</script> --- # 심혈관 생리지표 계산 최대최소값 표시 & [드래그](https://shiny.rstudio.com/gallery/plot-interaction-advanced.html)한 부분의 생리지표를 계산 [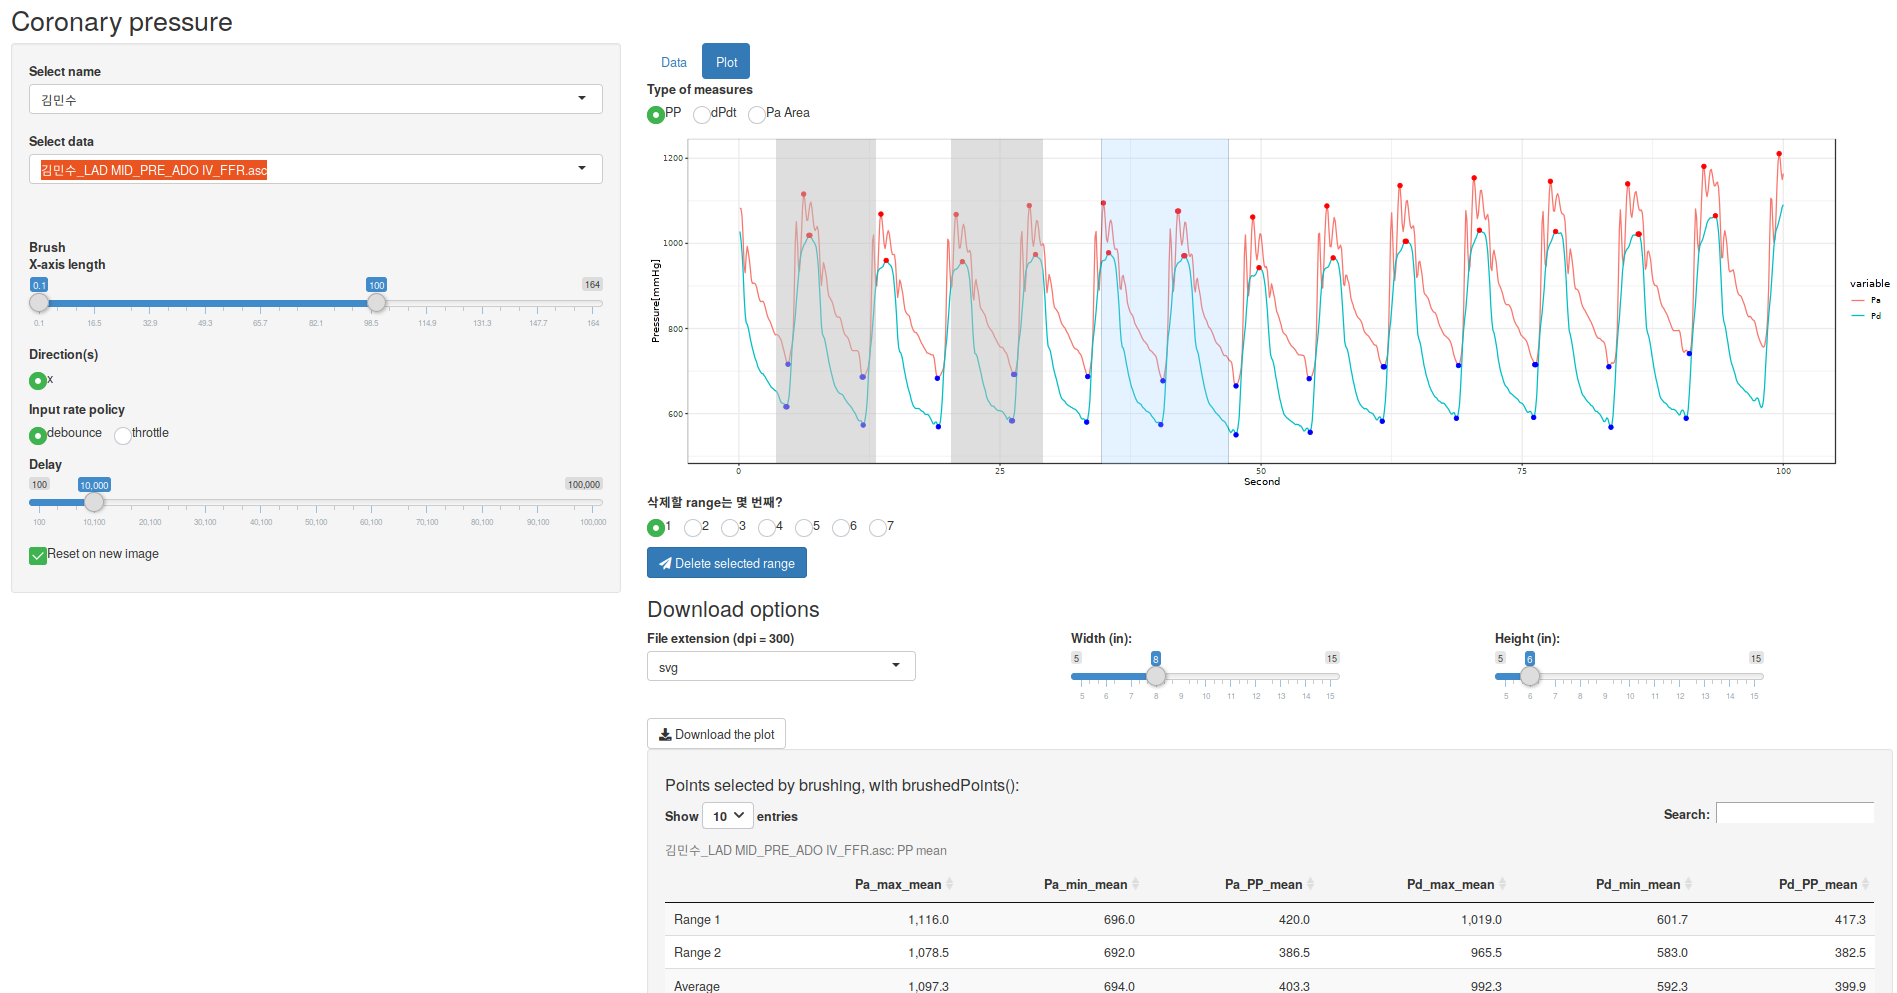](http://app.zarathu.com) --- # PTSD 네트워크 분석 [qgraph](https://CRAN.R-project.org/package=qgraph) 패키지 이용. [colourpicker](https://github.com/daattali/colourpicker), [shinyWidgets](https://github.com/dreamRs/shinyWidgets) 패키지로 색상 선택 UI. [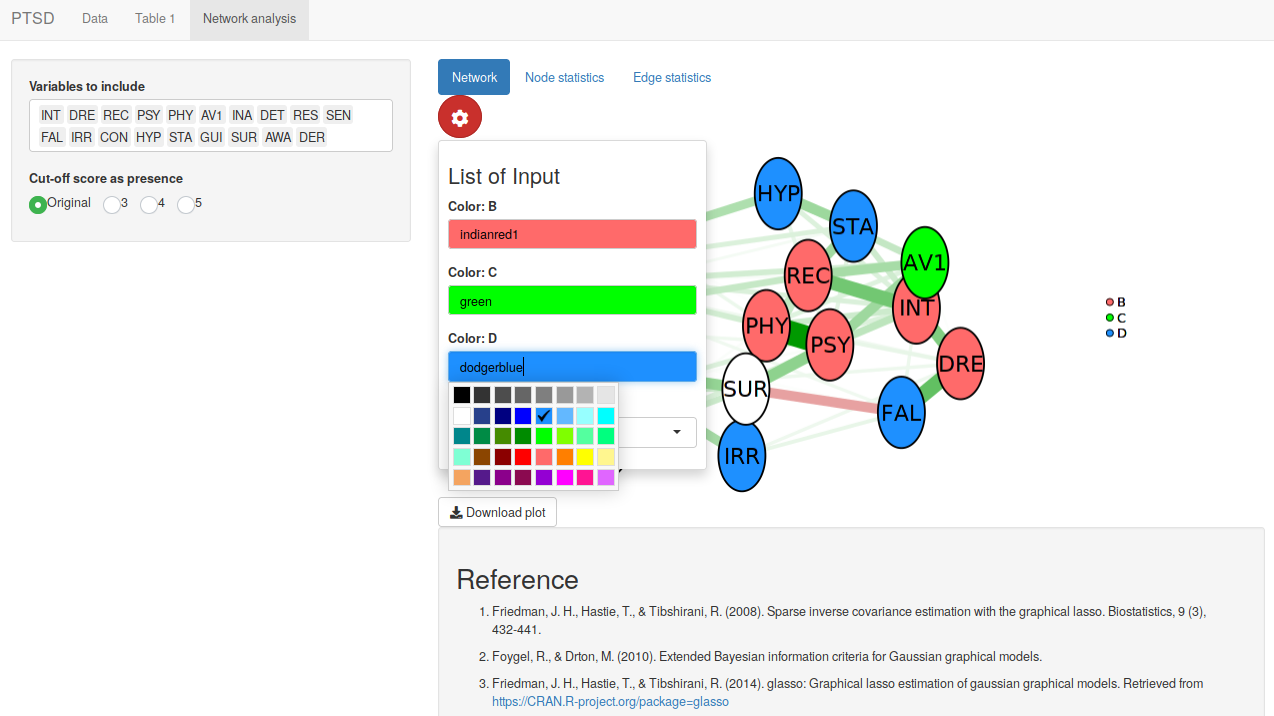](http://app.zarathu.com) --- class: center, middle # 범용 서비스 --- # 직접 데이터 업로드해서 이용 데이터 형태에 따라 3개로 따로 만듦. 기술통계, 회귀분석/생존분석, ROC 분석을 포함. * [일반 데이터](http://app.zarathu.com/basic) * [반복측정 데이터](http://app.zarathu.com/repeated) - 한 사람이 여러번 측정함, [GEE](https://en.wikipedia.org/wiki/Generalized_estimating_equation) 기반의 분석 필요. * [서베이(survey) 데이터](http://app.zarathu.com/survey) - 샘플가중치 존재(ex: 국건영) * [프로펜시티 점수 분석]((http://app.zarathu.com/ps)(experimental) --- # R 패키지: [jsmodule](https://github.com/jinseob2kim/jsmodule) 자신의 컴퓨터에서 직접 수행할 수 있도록 [Rstudio Addin 포함한 패키지](https://github.com/jinseob2kim/jsmodule)로 배포, [CRAN](https://cran.r-project.org/package=jsmodule) 등록됨. 그 외, 생존분석 그림을 위한 [jskm](https://cran.r-project.org/package=jskm), 회귀분석 테이블을 만드는 [jstable](https://cran.r-project.org/package=jstable) <img src="https://raw.githubusercontent.com/jinseob2kim/jsmodule/master/vignettes/figures/addin.gif" style="display: block; margin: auto;" /> --- ## 패키지 다운로드 수 [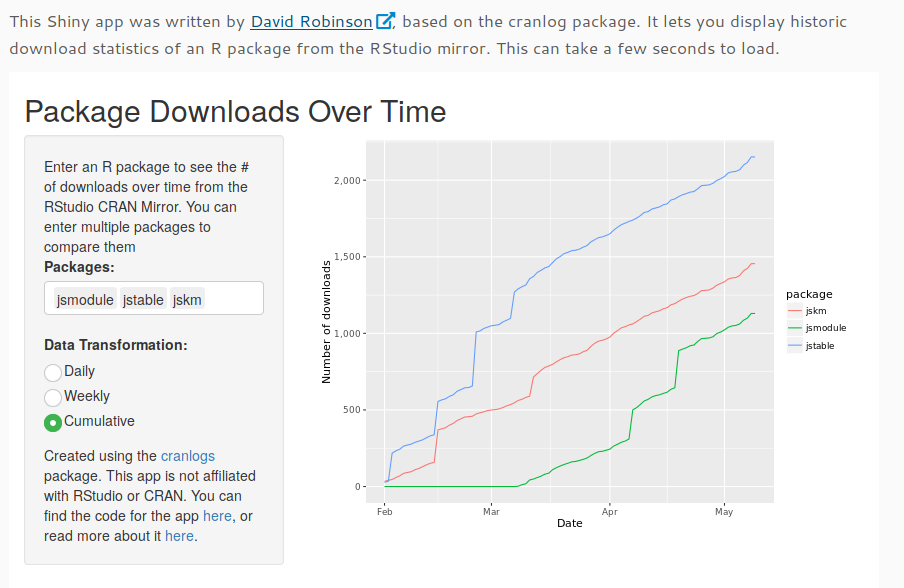](https://ipub.com/dev-corner/apps/r-package-downloads/) --- # 개발 & 배포환경 개발, 맞춤형 앱 * 대학원 서버에 [Docker 이미지](https://cloud.docker.com/u/jinseob2kim/repository/docker/jinseob2kim/docker-rshiny) 설치하여 기생. + R, Rstudio server, shiny server와 자주 쓰는 패키지를 미리 설치. -- 범용 앱 * AWS에 [Docker swarm](https://github.com/jinseob2kim/swarm-setting) 환경 구축. + 부하정도에 따라 자동으로 인스턴스 추가/삭제. 현재 1대면 충분.. -- 코드: [깃허브](https://github.com/jinseob2kim) * R 패키지, Docker 이미지, 홈페이지/블로그는 public repository * 맞춤형 앱은 private repository [RUCK2018 발표자료](https://blog.zarathu.com/posts/2018-11-08-ruck2018/) --- class: center, middle # 맞춤형 리포트 지원경험 --- # [레지스트리](http://pf.kakao.com/_XsuxgC/34113879) 연구 지원 데이터는 하나, 5개 연구주제 <img src="cobis.png" width="1179" style="display: block; margin: auto;" /> 원하는 논문테이블, 그림을 알려주면 리포트 제작. * 보안 문제로 **웹보다 리포트를 원함**. --- # 테이블 예시 ```r library(knitr);library(kableExtra) kable(mtcars[1:3, 1:6], row.names = T, caption = "Example", align = "c") %>% kable_styling(full_width = F) %>% add_header_above(c("", "A" = 2, "B" = 4)) %>% footnote(general = "Footnote") ``` <table class="table" style="width: auto !important; margin-left: auto; margin-right: auto;"> <caption>Example</caption> <thead> <tr> <th style="border-bottom:hidden" colspan="1"></th> <th style="border-bottom:hidden; padding-bottom:0; padding-left:3px;padding-right:3px;text-align: center; " colspan="2"><div style="border-bottom: 1px solid #ddd; padding-bottom: 5px; ">A</div></th> <th style="border-bottom:hidden; padding-bottom:0; padding-left:3px;padding-right:3px;text-align: center; " colspan="4"><div style="border-bottom: 1px solid #ddd; padding-bottom: 5px; ">B</div></th> </tr> <tr> <th style="text-align:left;"> </th> <th style="text-align:center;"> mpg </th> <th style="text-align:center;"> cyl </th> <th style="text-align:center;"> disp </th> <th style="text-align:center;"> hp </th> <th style="text-align:center;"> drat </th> <th style="text-align:center;"> wt </th> </tr> </thead> <tbody> <tr> <td style="text-align:left;"> Mazda RX4 </td> <td style="text-align:center;"> 21.0 </td> <td style="text-align:center;"> 6 </td> <td style="text-align:center;"> 160 </td> <td style="text-align:center;"> 110 </td> <td style="text-align:center;"> 3.90 </td> <td style="text-align:center;"> 2.620 </td> </tr> <tr> <td style="text-align:left;"> Mazda RX4 Wag </td> <td style="text-align:center;"> 21.0 </td> <td style="text-align:center;"> 6 </td> <td style="text-align:center;"> 160 </td> <td style="text-align:center;"> 110 </td> <td style="text-align:center;"> 3.90 </td> <td style="text-align:center;"> 2.875 </td> </tr> <tr> <td style="text-align:left;"> Datsun 710 </td> <td style="text-align:center;"> 22.8 </td> <td style="text-align:center;"> 4 </td> <td style="text-align:center;"> 108 </td> <td style="text-align:center;"> 93 </td> <td style="text-align:center;"> 3.85 </td> <td style="text-align:center;"> 2.320 </td> </tr> </tbody> <tfoot> <tr><td style="padding: 0; border: 0;" colspan="100%"><span style="font-style: italic;">Note: </span></td></tr> <tr><td style="padding: 0; border: 0;" colspan="100%"> <sup></sup> Footnote</td></tr> </tfoot> </table> --- # 심평원/보험공단 연구 지원 인터넷 연결(X), 리포트로 만들어서 반출 신청해야됨. <div class="figure" style="text-align: center"> <img src="rmdreport2.png" alt="리포트" width="983" /> <p class="caption">리포트</p> </div> --- # 전부 SAS 파일 `haven::read_sas` 로 읽어야 함. ```r library(haven);library(dplyr) ## 월별 명세서 데이터 data.t20 <- list.files(pattern = "t20") %>% lapply(read_sas) %>% bind_rows ## 월별 x-ray 데이터 data.xray <- list.files(pattern = "t30") %>% lapply(function(x){ read_sas(x) %>% filter(substr(MCARE_DIV_CD_ADJ, 1, 3) == "G21") %>% select(CMN_KEY, MCARE_DIV_CD_ADJ)}) %>% bind_rows ``` --- # Executive Summary .large[ * [R](https://www.r-project.org/)로 통계분석 뿐 아니라 [논문](https://github.com/rstudio/rticles), [발표 슬라이드](https://github.com/yihui/xaringan), [홈페이지](https://github.com/rstudio/blogdown), [블로그](https://rstudio.github.io/distill/), [웹 어플리케이션](https://shiny.rstudio.com/)을 만들 수 있다. * 의학연구자들에게 [맞춤형 통계 웹](http://app.zarathu.com)을 제공하는 것을 업으로 삼고 있다. * 범용으로 쓰일만한 것들을 [웹](http://app.zarathu.com)과 [R 패키지](https://github.com/jinseob2kim/jsmodule)로 배포한다. * [심혈관중재학회](http://www.kscvi.org/new_ksic2015/community/main/kbc)와 계약, 1년간 [레지스트리](https://clinicaltrials.gov/ct2/show/NCT03068494) 연구에 대한 통계지원을 맡고 있다. * [심평원](https://opendata.hira.or.kr/)/[보험공단](https://nhiss.nhis.or.kr/) 빅데이터 연구도 개별적으로 지원중. ] --- class: center, middle # END